Global Dairy Alternatives Market, Consumption Volume (by Source, Region & Application) And 20 Company Profile - Forecast To 2024
The global dairy alternatives market is expected to surpass US$ 34 Billion mark by 2024. Dairy alternative is derived from the plant based milk sources and is lactose and casein free. Dairy alternative is manufactured by using various plant based sources like soy, almond, coconut, rice, hazelnut and many more.�
The global dairy alternatives market is expected to surpass US$ 34 Billion mark by 2024. Dairy alternative is derived from the plant based milk sources and is lactose and casein free. Dairy alternative is manufactured by using various plant based sources like soy, almond, coconut, rice, hazelnut and many more. Today, food intolerances and food allergies have become a major concern for health-conscious consumers. Following a dairy-free diet has numerous benefits, and is widely exercised by health-conscious consumers and fitness enthusiasts.
The increasing awareness of consumers towards a vegan diet, nutritional benefits provided by such foods, lactose intolerance among the population and demand for various fortified dairy food & beverage applications are some of the factors expected to propel the growth of dairy alternatives market in the coming years. Some of the key factors inhibiting the growth of dairy alternatives market includes cross contamination of raw materials and high price of dairy alternative products.
Global Dairy Alternatives Market - by Source
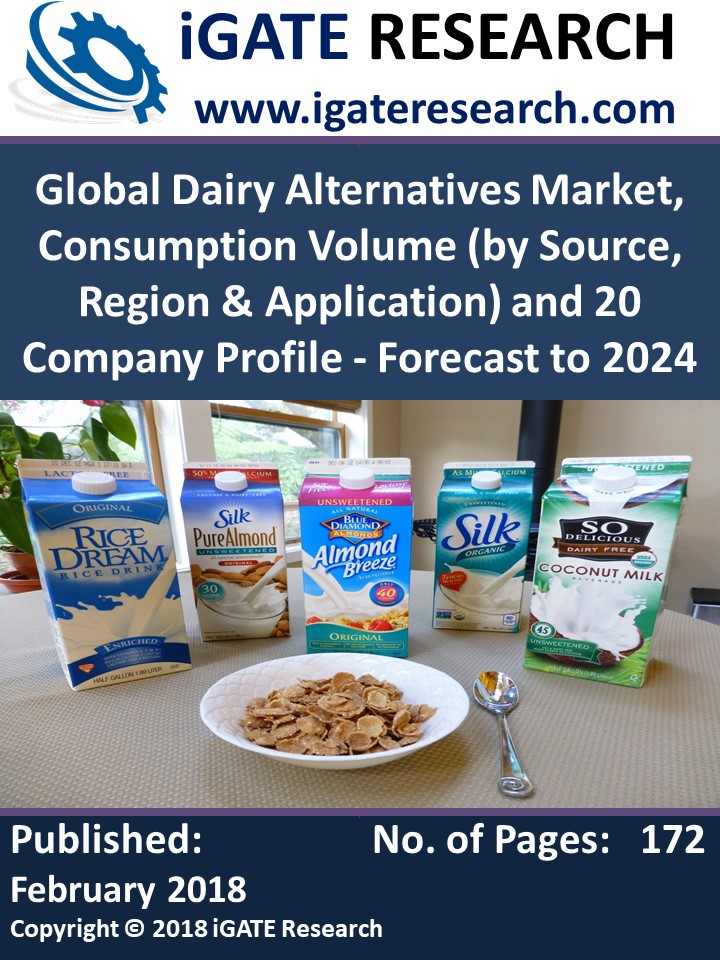
• In terms of source, the soy segment accounts for largest share of the dairy alternatives market.
• The popularity of soy milk can be attributed to the plethora of varieties, in terms of flavors, blends, fat content, and formulations offered by leading dairy alternative manufacturers.
• The almond milk is one of the fastest segment in the dairy alternatives market.
• Rice milk captures third highest share of the dairy alternatives market. Rice milk is a great alternative to conventional milk with its benefits such as free-from cholesterol and lactose.
• Coconut milk captures least share of the dairy alternatives market.
Global Dairy Alternatives Market - Region Analysis
• Geographically, the global dairy alternatives market is dominated by Asia-Pacific region.
• North America is the second largest market for dairy alternatives, being closely followed by the European region. The dairy alternatives market in these regions is driven by rapid growth in the consumption of dairy alternative products, mainly due to the increased disposable income, changes in the lifestyle and dietary patterns.
• In Latin America, Brazil, Mexico and Argentina are observing high demand for dairy alternatives.
Global Dairy Alternatives Market - By Application
• In 2017, beverages segment accounted for lion’s share of the global dairy alternative market.
• The food segment accounted for nearly 45% share of the global dairy alternative market in 2017.
iGATE RESEARCH report titled “Global Dairy Alternatives Market, Consumption Volume (by Source, Region & Application) and 20 Company Profile - Forecast to 2024” provides a comprehensive assessment of the fast-evolving, high-growth Global Dairy Alternatives Market.
This 172 Page report with 77 Figures and 4 Tables has been analyzed from 7 viewpoints:
1. Global Dairy Alternatives (Plant-Based Milk) Market & Volume Forecast (2011 - 2024)
2. Global Dairy Alternatives Market Share & Forecast (2011 - 2024)
3. Global Dairy Alternatives Market, Volume & Forecast - By Source (2011 - 2024)
4. Global Dairy Alternatives Market, Volume & Forecast - By Region (2011 - 2024)
5. Global Dairy Alternatives Market, Volume & Forecast - By Application (2011 - 2024)
6. Companies Profile - Overview, Strategy/ Initiatives/ Recent Developments/ Major Deals, Financial Insights
7. Global Dairy Alternatives Market - Driving Factors and Challenges
Global Dairy Alternatives Market, Volume & Forecast - By Source (2011 - 2024)
1. Soy
2. Almond
3. Rice
4. Coconut
5. Others
Global Dairy Alternatives Market, Volume & Forecast - By Region (2011 - 2024)
1. North America
2. Latin America
3. Asia-Pacific
4. Europe
5. Rest of the World
Global Dairy Alternatives Market, Volume & Forecast - By Application (2011 - 2024)
1. Food
2. Beverages
Global Dairy Alternatives Market - Company Profiles
1. WhiteWave Foods Company
2. Hain Celestial Group Inc.
3. Blue Diamond Growers, Inc.
4. Organic Valley
5. SunOpta Inc.
6. Sanitarium Health and Wellbeing Company
7. Freedom Foods Group Limited
8. Kikkoman
9. Vitasoy International Holdings Limited
10. Living Harvest Foods Inc.
11. Nutriops S.L
12. Eden Foods Inc.
13. Earth’s Own Food Company Inc.
14. Triballat Noyal
15. Valsoia SpA
16. Daiya Foods Inc. (Acquired by Otsuka Pharmaceutical Co., Ltd.)
17. Döhler GmbH
18. Archer Daniels Midland Company
19. Danone
20. GRUPO LECHE PASCUAL, S.A.
Data Sources
iGATE RESEARCH employs rigorous primary and secondary research techniques in developing distinctive data sets and research material for business reports. This report is built by using data and information sourced from Proprietary Information Database, Primary and Secondary Research Methodologies, and In house analysis by iGATE Research dedicated team of qualified professionals with deep industry experience and expertise.
Research Methodologies
Primary Research Methodologies: Questionnaires, Surveys, Interviews with Individuals, Small Groups, Telephonic Interview, etc.
Secondary Research Methodologies: Printable and Non-printable sources, Newspaper, Magazine and Journal Content, Government and NGO Statistics, white Papers, Information on the Web, Information from Agencies Such as Industry Bodies, Companies Annual Report, Government Agencies, Libraries and Local Councils and a large number of Paid Databases.
1. Executive Summary
2. Global Dairy Alternatives (Plant-Based Milk) Market & Volume Forecast (2011 - 2024)
2.1 Global Dairy Alternatives Market & Forecast
2.2 Global Dairy Alternatives Volume & Forecast
3. Global Dairy Alternatives Market Share & Forecast (2011 - 2024)
3.1 By Source - Global Dairy Alternatives Market Share & Forecast
3.2 By Application - Global Dairy Alternatives Market & Forecast
3.3 By Region - Global Dairy Alternatives Market Share & Forecast
4. Global Dairy Alternatives Market, Volume & Forecast - By Source (2011 - 2024)
4.1 Dairy Alternatives - Soy Milk Market, Volume & Forecast (2011 - 2024)
4.1.1 Soy Milk Market & Forecast
4.1.2 Soy Milk Volume & Forecast
4.2 Dairy Alternatives - Almond Milk Market, Volume & Forecast (2011 - 2024)
4.2.1 Almond Milk Market & Forecast
4.2.2 Almond Milk Volume & Forecast
4.3 Dairy Alternatives - Rice Milk Market, Volume & Forecast (2011 - 2024)
4.3.1 Rice Milk Market & Forecast
4.3.2 Rice Milk Volume & Forecast
4.4 Dairy Alternatives - Coconut Milk Market, Volume & Forecast (2011 - 2024)
4.4.1 Coconut Milk Market & Forecast
4.4.2 Coconut Milk Volume & Forecast
4.5 Dairy Alternatives - Others Milk Market, Volume & Forecast (2011 - 2024)
4.5.1 Others Milk Market & Forecast
4.5.2 Others Milk Volume & Forecast
5. Global Dairy Alternatives Market, Volume & Forecast - By Region (2011 - 2024)
5.1 North America - Dairy Alternatives Market, Volume & Forecast (2011 - 2024)
5.1.1 North America Dairy Alternatives Market & Forecast
5.1.2 North America Dairy Alternatives Volume & Forecast
5.2 Latin America - Dairy Alternatives Market, Volume & Forecast (2011 - 2024)
5.2.1 Latin America Dairy Alternatives Market & Forecast
5.2.2 Latin America Dairy Alternatives Volume & Forecast
5.3 Asia Pacific - Dairy Alternatives Market, Volume & Forecast (2011 - 2024)
5.3.1 Asia Pacific Dairy Alternatives Market & Forecast
5.3.2 Asia Pacific Dairy Alternatives Volume & Forecast
5.4 Europe - Dairy Alternatives Market, Volume & Forecast (2011 - 2024)
5.4.1 Europe Dairy Alternatives Market & Forecast
5.4.2 Europe Dairy Alternatives Volume & Forecast
5.5 Rest of the World - Dairy Alternatives Market, Volume & Forecast (2011 - 2024)
5.5.1 Rest of the World Dairy Alternatives Market & Forecast
5.5.2 Rest of the World Dairy Alternatives Volume & Forecast
6. Global Dairy Alternatives Market, Volume & Forecast - By Application (2011 - 2024)
6.1 Food - Dairy Alternatives Market, Volume & Forecast (2011 - 2024)
6.1.1 Food - Dairy Alternatives Market & Forecast
6.1.2 Food - Dairy Alternatives Volume & Forecast
6.2 Beverages - Dairy Alternatives Market, Volume & Forecast (2011 - 2024)
6.2.1 Beverages - Dairy Alternatives Market & Forecast
6.2.2 Beverages - Dairy Alternatives Volume & Forecast
7. Companies Profile
7.1 WhiteWave Foods Company
7.1.1 Overview
7.1.2 Strategy/ Initiatives/ Recent Developments
7.1.3 Major Deals
7.1.4 Financial Insights
7.2 Hain Celestial Group Inc.
7.2.1 Overview
7.2.2 Strategy/ Initiatives/ Recent Developments
7.2.3 Major Deals
7.2.4 Financial Insights
7.3 Blue Diamond Growers, Inc.
7.3.1 Overview
7.3.2 Strategy/ Initiatives/ Recent Developments
7.3.3 Financial Insights
7.4 Organic Valley
7.4.1 Overview
7.4.2 Strategy/ Initiatives/ Recent Developments
7.4.3 Major Deals
7.4.4 Financial Insights
7.5 SunOpta Inc.
7.5.1 Overview
7.5.2 Strategy/ Initiatives/ Recent Developments
7.5.3 Major Deals
7.5.4 Financial Insights
7.6 Sanitarium Health and Wellbeing Company
7.6.1 Overview
7.6.2 Strategy/ Initiatives/ Recent Developments
7.7 Freedom Foods Group Limited
7.7.1 Overview
7.7.2 Strategy/ Initiatives/ Recent Developments
7.7.3 Major Deals
7.7.4 Financial Insights
7.8 Kikkoman
7.8.1 Overview
7.8.2 Strategy/ Initiatives/ Recent Developments
7.8.3 Financial Insights
7.9 Vitasoy International Holdings Limited
7.9.1 Overview
7.9.2 Strategy/ Initiatives/ Recent Developments
7.9.3 Major Deals
7.9.4 Financial Insights
7.10 Living Harvest Foods Inc.
7.10.1 Overview
7.10.2 Financial Insights
7.11 Nutriops S.L
7.12 Eden Foods Inc.
7.13 Earth’s Own Food Company Inc.
7.13.1 Overview
7.13.2 Strategy/ Initiatives/ Recent Developments
7.14 Triballat Noyal
7.15 Valsoia SpA
7.15.1 Overview
7.15.2 Financial Insights
7.16 Daiya Foods Inc. (Acquired by Otsuka Pharmaceutical Co., Ltd.)
7.16.1 Overview
7.16.2 Strategy/ Initiatives/ Recent Developments
7.16.3 Major Deals
7.17 Döhler GmbH
7.17.1 Overview
7.17.2 Major Deals
7.18 Archer Daniels Midland Company
7.18.1 Overview
7.18.2 Strategy/ Initiatives/ Recent Developments
7.18.3 Major Deals
7.18.4 Financial Insights
7.19 Danone
7.19.1 Overview
7.19.2 Major Deals
7.19.3 Financial Insights
7.20 GRUPO LECHE PASCUAL, S.A.
8. Global Dairy Alternatives Market - Growth Drivers
8.1 Increase in lactose Intolerance and Dairy Allergic Consumers
8.2 Non-Dairy Milk Sales Growth is Outpacing Regular Milk
8.3 Changing Dietary Lifestyles and Genetic Disorders
8.4 Increasing Demand from Developing Countries
9. Global Dairy Alternatives Market - Challenges
9.1 Cross Contamination of Raw Materials
9.2 High Price of Dairy Alternative Milk
List of Figures:
Figure 2-1: Global Dairy Alternatives Market (Million US$), 2011 - 2017
Figure 2-2: Forecast for Global Dairy Alternatives Market (Million US$), 2018 - 2024
Figure 2-3: Global Dairy Alternatives Volume (Million Litres), 2011 - 2017
Figure 2-4: Forecast for Global Dairy Alternatives Volume (Million Litres), 2018 - 2024
Figure 3-1: By Application - Global Dairy Alternatives Market Share (Percent), 2011 - 2017
Figure 3-2: By Application - Forecast for Global Dairy Alternatives Market Share (Percent), 2018 - 2024
Figure 4-1: Dairy Alternatives - Soy Milk Market (Million US$), 2011 - 2017
Figure 4-2: Dairy Alternatives - Forecast for Soy Milk Market (Million US$), 2018 - 2024
Figure 4-3: Dairy Alternatives - Soy Milk Volume (Million Litres), 2011 - 2017
Figure 4-4: Dairy Alternatives - Forecast for Soy Milk Volume (Million Litres), 2018 - 2024
Figure 4-5: Dairy Alternatives - Almond Milk Market (Million US$), 2011 - 2017
Figure 4-6: Dairy Alternatives - Forecast for Almond Milk Market (Million US$), 2018 - 2024
Figure 4-7: Dairy Alternatives - Almond Milk Volume (Million Litres), 2011 - 2017
Figure 4-8: Dairy Alternatives - Forecast for Almond Milk Volume (Million Litres), 2018 - 2024
Figure 4-9: Dairy Alternatives - Rice Milk Market (Million US$), 2011 - 2017
Figure 4-10: Dairy Alternatives - Forecast for Rice Milk Market (Million US$), 2018 - 2024
Figure 4-11: Dairy Alternatives - Rice Milk Volume (Million Litres), 2011 - 2017
Figure 4-12: Dairy Alternatives - Forecast for Rice Milk Volume (Million Litres), 2018 - 2024
Figure 4-13: Dairy Alternatives - Coconut Milk Market (Million US$), 2011 - 2017
Figure 4-14: Dairy Alternatives - Forecast for Coconut Milk Market (Million US$), 2018 - 2024
Figure 4-15: Dairy Alternatives - Coconut Milk Volume (Million Litres), 2011 - 2017
Figure 4-16: Dairy Alternatives - Forecast for Coconut Milk Volume (Million Litres), 2018 - 2024
Figure 4-17: Dairy Alternatives - Others Milk Market (Million US$), 2011 - 2017
Figure 4-18: Dairy Alternatives - Forecast for Others Milk Market (Million US$), 2018 - 2024
Figure 4-19: Dairy Alternatives - Others Milk Volume (Million Litres), 2011 - 2017
Figure 4-20: Dairy Alternatives - Forecast for Others Milk Volume (Million Litres), 2018 - 2024
Figure 5-1: North America - Dairy Alternatives Market (Million US$), 2011 - 2017
Figure 5-2: North America - Forecast for Dairy Alternatives Market (Million US$), 2018 - 2024
Figure 5-3: North America - Dairy Alternatives Volume (Million Litres), 2011 - 2017
Figure 5-4: North America - Forecast for Dairy Alternatives Volume (Million Litres), 2018 - 2024
Figure 5-5: Latin America - Dairy Alternatives Market (Million US$), 2011 - 2017
Figure 5-6: Latin America - Forecast for Dairy Alternatives Market (Million US$), 2018 - 2024
Figure 5-7: Latin America - Dairy Alternatives Volume (Million Litres), 2011 - 2017
Figure 5-8: Latin America - Forecast for Dairy Alternatives Volume (Million Litres), 2018 - 2024
Figure 5-9: Asia Pacific - Dairy Alternatives Market (Million US$), 2011 - 2017
Figure 5-10: Asia Pacific - Forecast for Dairy Alternatives Market (Million US$), 2018 - 2024
Figure 5-11: Asia Pacific - Dairy Alternatives Volume (Million Litres), 2011 - 2017
Figure 5-12: Asia Pacific - Forecast for Dairy Alternatives Volume (Million Litres), 2018 - 2024
Figure 5-13: Europe - Dairy Alternatives Market (Million US$), 2011 - 2017
Figure 5-14: Europe - Forecast for Dairy Alternatives Market (Million US$), 2018 - 2024
Figure 5-15: Europe - Dairy Alternatives Volume (Million Litres), 2011 - 2017
Figure 5-16: Europe - Forecast for Dairy Alternatives Volume (Million Litres), 2018 - 2024
Figure 5-17: Rest of the World - Dairy Alternatives Market (Million US$), 2011 - 2017
Figure 5-18: Rest of the World - Forecast for Dairy Alternatives Market (Million US$), 2018 - 2024
Figure 5-19: Rest of the World - Dairy Alternatives Volume (Million Litres), 2011 - 2017
Figure 5-20: Rest of the World - Forecast for Dairy Alternatives Volume (Million Litres), 2018 - 2024
Figure 6-1: Dairy Alternatives - Food Market (Million US$), 2011 - 2017
Figure 6-2: Dairy Alternatives - Forecast for Food Market (Million US$), 2018 - 2024
Figure 6-3: Dairy Alternatives - Food Volume (Million Litres), 2011 - 2017
Figure 6-4: Dairy Alternatives - Forecast for Food Volume (Million Litres), 2018 - 2024
Figure 6-5: Dairy Alternatives - Beverages Market (Million US$), 2011 - 2017
Figure 6-6: Dairy Alternatives - Forecast for Beverages Market (Million US$), 2018 - 2024
Figure 6-7: Dairy Alternatives - Beverages Volume (Million Litres), 2011 - 2017
Figure 6-8: Dairy Alternatives - Forecast for Beverages Volume (Million Litres), 2018 - 2024
Figure 7-1: WhiteWave Foods Company - Net Sales (Million US$), 2010 - 2017
Figure 7-2: WhiteWave Foods Company - Forecast for Net Sales (Million US$), 2018 - 2024
Figure 7-3: WhiteWave Foods Company - Plant-Based Foods and Beverages Net Sales (Million US$), 2010 - 2017
Figure 7-4: WhiteWave Foods Company - Forecast for Plant-Based Foods and Beverages Net Sales (Million US$), 2018 - 2024
Figure 7-5: Hain Celestial - Net Sales (Million US$), 2010 - 2017
Figure 7-6: Hain Celestial - Forecast for Net Sales (Million US$), 2018 - 2024
Figure 7-7: Blue Diamond Growers, Inc. - Net Sales (Million US$), 2010 - 2017
Figure 7-8: Blue Diamond Growers, Inc. - Forecast for Net Sales (Million US$), 2018 - 2024
Figure 7-9: Organic Valley - Net Sales (Million US$), 2010 - 2017
Figure 7-10: Organic Valley - Forecast for Net Sales (Million US$), 2018 - 2024
Figure 7-11: SunOpta Inc. - Net Sales (Million US$), 2010 - 2017
Figure 7-12: SunOpta Inc. - Forecast for Net Sales (Million US$), 2018 - 2024
Figure 7-13: Freedom Foods Group Limited - Net Sales (Million US$), 2010 - 2017
Figure 7-14: Freedom Foods Group Limited - Forecast for Net Sales (Million US$), 2018 - 2024
Figure 7-15: Kikkoman Corporation - Net Sales (Million US$), 2010 - 2017
Figure 7-16: Kikkoman Corporation - Forecast for Net Sales (Million US$), 2018 - 2024
Figure 7-17: Vitasoy International Holdings Ltd. - Net Sales (Million US$), 2010 - 2017
Figure 7-18: Vitasoy International Holdings Ltd. - Forecast for Net Sales (Million US$), 2018 - 2024
Figure 7-19: Valsoia S.p.A - Net Sales (Million US$), 2013 - 2017
Figure 7-20: Valsoia S.p.A - Forecast for Net Sales (Million US$), 2018 - 2024
Figure 7-21: Archer Daniels Midland Company - Net Sales (Million US$), 2012 - 2016
Figure 7-22: Danone - Net Sales (Million US$), 2012 - 2016
Figure 8-1: Non-Dairy Milk Sales Growth is Outpacing Regular Milk (Percent), 2007 - 2016
List of Tables:
Table 3-1: By Source - Global Dairy Alternatives Market Share (Percent), 2011 - 2017
Table 3-2: By Source - Forecast for Global Dairy Alternatives Market Share (Percent), 2018 - 2024
Table 3-3: By Region - Global Dairy Alternatives Market Share (Percent), 2011 - 2017
Table 3-4: By Region - Forecast for Global Dairy Alternatives Market Share (Percent), 2018 - 2024
- Single User License : $1,800
- Multi User License : $2,600
- CD-ROM Mail Delivery : $2,000
- Hard-Copy Mail Delivery : $2,000
- Life Sciences
- » Pharmaceuticals
- » Diagnostics
- » Medical Devices
- » Vaccines
- Information Technology & Telecom
- » Network & Software
- » Technology
- » Internet & Ecommerce
- Travel & Tourism
- » Mice Tourism
- » Travel & Leisure
- » Medical Tourism
- Heavy Industries
- » Transportation & Shipping
- » Energy & Resources
- Consumer Goods & Retail
- » Consumer Electronics
- » Retailing & Consumer Trend Services
- Plastics & Other Polymers
- Food And Beverages
- General Reports